The Art of Data Visualization: Telling Stories with Data
As someone who has spent quite some time in the field of data visualization, I can't help but marvel at the power of a well-crafted data visualization. It's not just about creating pretty charts and graphs; it's about telling compelling stories with data. In this blog post, I want to take you on a journey through the art of data visualization, sharing some of my personal experiences and insights into how to effectively communicate with data.
The Power of Visual Communication
Data visualization is, at its core, a form of visual communication. It's about translating raw data into visual representations that people can easily understand. We humans are inherently visual creatures, and we process visual information much faster than text or numbers. That's why a well-designed data visualization can make complex datasets accessible and engaging.
Throughout my career, I've encountered countless instances where data was crucial but difficult to convey. Whether I was working in a scientific research project, a business analytics team, or consulting for an acturial company, the ability to convey insights through data visualization has been invaluable.
Start with a Clear Purpose
One of the most crucial aspects of data visualization is to start with a clear purpose in mind. What story are you trying to tell with your data? Who is your audience, and what do they need to know? These are the fundamental questions that should guide your visualization process.
For instance, I once worked on a project related to crowd dynamics, where the goal was to visualize escape scenarios in a closed enviroment in case of emergency. The purpose was clear: identify bottlenecks and improve crowd flow. By focusing on this clear goal, we designed a dashboard that not only provided real-time insights but also helped in formulating data-driven decisions to reduce escape times.
Choose the Right Visualization Method
Selecting the right visualization method is like choosing the right brush for a painting. It can make all the difference. Whether it's bar charts, line graphs, pie charts, scatter plots, or more complex visualizations like heatmaps or Sankey diagrams, each has its strengths and weaknesses. Understanding the data and the message you want to convey is key to making the right choice.
In my experience, I've learned that simplicity often wins. One of my favorite examples is the "Gapminder" visualization by Hans Rosling. He used scatter plots to show the relationship between life expectancy, income, and population. The result was a mesmerizing animation that told a story of global development over time, and it was beautifully simple.
Design Matters
Design is an integral part of data visualization. It's not just about making things look pretty; it's about making them effective. Color, typography, and layout play a crucial role in guiding the viewer's attention and conveying the message.
In my work, I've learned that less is often more. A cluttered chart or graph can confuse rather than enlighten. I've also found that color should be used thoughtfully, not just for aesthetics but to highlight important data points or relationships. As a professional in this field, I've often had to strike a balance between creating visually appealing visuals and ensuring they serve their primary purpose: data communication.
Interactivity and Engagement
In today's world, where data is abundant, interactive visualizations have become increasingly important. Tools like Tableau, Power BI, and D3.js have made it easier than ever to create interactive data dashboards. This interactivity allows users to explore the data, uncover insights, and engage with the story on a deeper level.
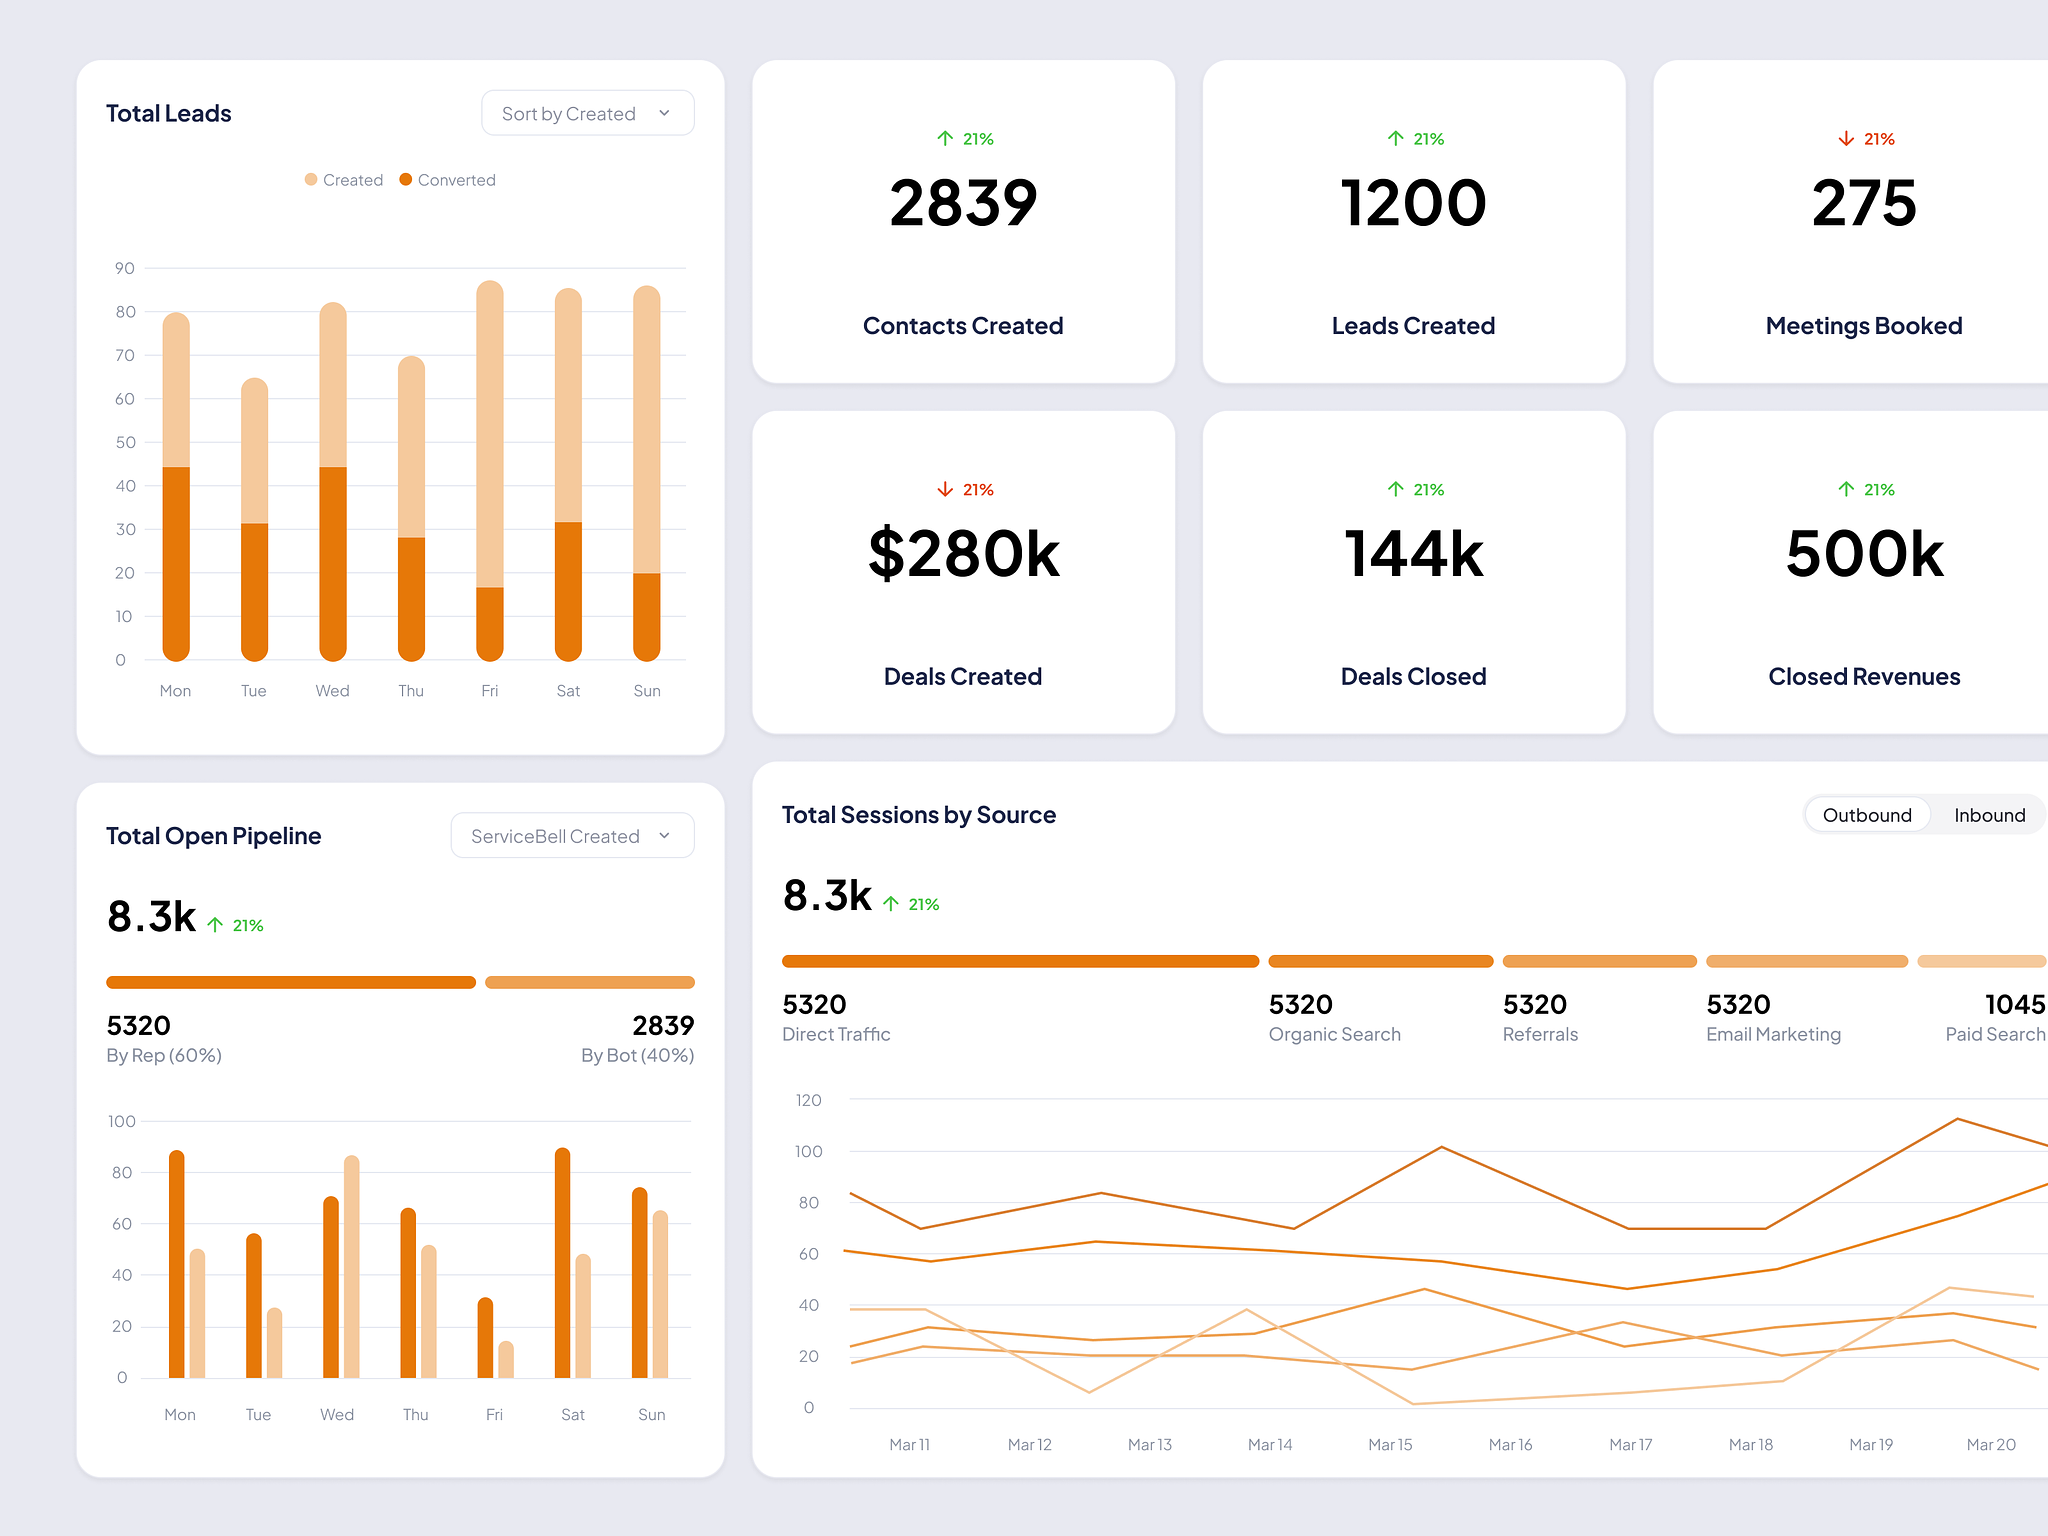
For a project I worked on with an e-commerce company, we created an interactive sales dashboard that allowed users to drill down into sales data by product category, region, and time period. The interactivity made it possible for sales teams to identify trends, set targets, and make data-driven decisions in real time.
The Art of Iteration
Data visualization is not a one-and-done process. It's an iterative journey. As an expert in the field, I've often found that the initial visualization rarely gets it exactly right. Feedback from users, changes in data, and evolving goals may require constant adjustments and improvements.
The key is to be open to feedback and willing to refine your visualizations. In the early stages of my career, I sometimes felt attached to my initial designs, but I've come to realize that the best visualizations are born through a process of continuous refinement.
Conclusion
The art of data visualization is a captivating journey that combines creativity, data science, and storytelling. It's not just about charts and graphs; it's about making data come alive and enabling others to see the insights hidden within. As an expert in this field, I've witnessed firsthand the impact a well-crafted visualization can have on decision-making, knowledge sharing, and driving positive change.
So, the next time you find yourself faced with a daunting dataset, remember that data visualization is not just a tool; it's an art form. Approach it with purpose, choose the right methods, design with clarity, embrace interactivity, and never stop iterating. By doing so, you'll unlock the true potential of data visualization and become a masterful storyteller with data.